

As a followup on yesterdays article providing tips and infograpic graphics to get started creating your own inforgraphics, I have collected a set of special infographics all build around maps as a key element. This is mainly to provide more inspiration and ideas for how data can be presented in a clever way but also because infographic maps are often really cool.
As you probalbly know infographics have been used more and more recently to deliver complex and detailed data in a very interactive and easy to consume way. Today information graphics surround us in all kinds of media, e.g. in printed magazines, in advertising but certainly also online. Events like Olympics 2012 of course have been analysed from all angles and described in various cool Olympics infographics. It can be both fun and a great way to get an overview and learn about new areas. However for marketing people infographics help delivering a clear message effectively and allow for certain aspects to be highlighted…
One of the typical use cases of infographics is to present demographic data and here map illustrations tend to be really useful. For this article I have found excellent examples of infographical maps for you inspiration. Keep in mind that some infographics are very long and therefore have been cut over here. Follow the links to see the full graphics. Enjoy!
[exec]$filestr = file_get_contents(‘http://www.tripwiremagazine.com/googleadsensebelowmoretag.inc’);echo $filestr;[/exec]
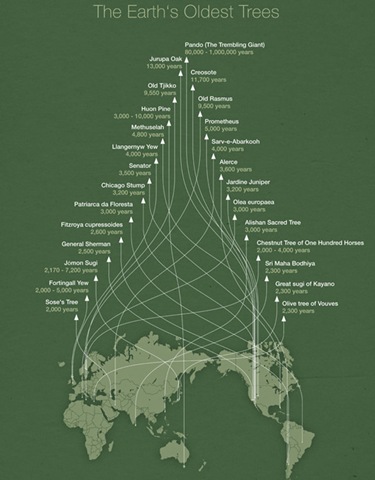
Trembling Giants
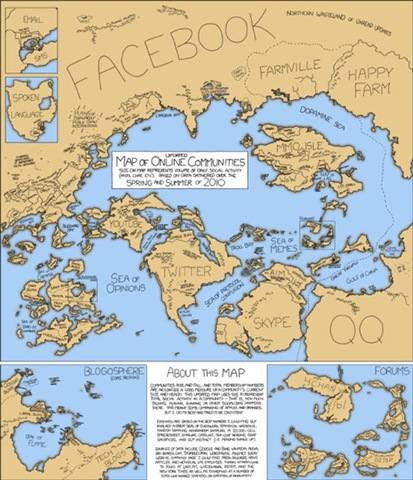
Map of Online Communities 2
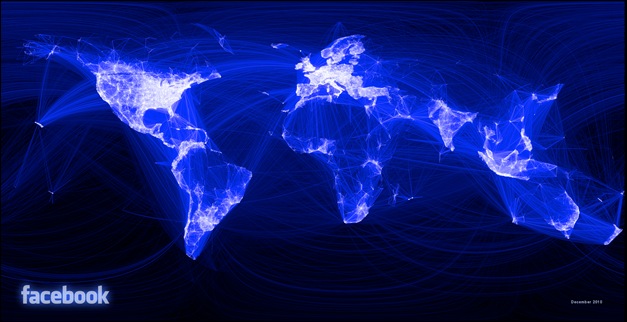
Facebook User Interaction Map
The Optimization of the Olympic Games
Infographic: A Map Of America’s 1,000 Breweries
US Bank Closures
Swine flu map of Britain
How the World Uses Social Network
A guide to buying your own island
Digital Dump
Smoking
Banking on the World Bank
Fortifying Foods to Prevent Disease
Top Languages on the Internet
Who’s Buying That?
Submarine Cable Map
Word Map of Social Network
Where the jobs have been Hiding
Reservations Census
National Debt
Oil Imports to the USA
Die Hard
Starbucks
Richest World Leaders
Cyber Stalking: the dangers of over sharing information
The Best Beer in America
Action Sheet: Clearing the Air
A Graphical History of the U.S. Flag
Social Professionals
The World’s Resources by Country
Which Countries Are Making the Most Progress on the Millennium Development Goals
Lars is passionate about web design, web development, SEO, social media and loves to look into new technologies, techniques, tools etc. and to write articles for tripwire magazine readers.


Nice job. kudos
nice maps. thanks for shared