

Infograpics have become so popular these days and as a result more and more high quality infographic design kits are made available to help designers. Infographics can be used very effectively to present complex data in a nice visual and powerful way. It is done using hand-picked design elements that relate to the data they represent e.g. demographic data can be effectively illustrated using small carefully colored human icons as overlay on a simplified map.
Online marketers love infographics for their ability to go viral on social networks and often they are offered as easy to embed code making it fast and simple for e.g. bloggers to share them in posts… very useful value oriented way to build links and online presence.
Infograpics designs are also used commercially in information products. Gartner Groups Hype Cycle is a well known example of an infographic (at least in the enterprise IT space) that deliver high value data in a delicious and branded way.
The huge availability of amazing infographics makes it critical to stand out and have a unique and clever design. This is not easy at all but trust me … some cool infographic design elements can be real life savers! They can be used as inspiration for how to model certain type of data and of course to save tons of valuable time required for drawing up the detailed vector graphics from scratch. Elements from different infographic design kits may be used together and add up to an awesome unique design. Here in this article I will start out with some tips on designing infographics that matters and I will present some really useful resources to help you create your own stunning infograpics and on time.
[exec]$filestr = file_get_contents(‘http://www.tripwiremagazine.com/googleadsensebelowmoretag.inc’);echo $filestr;[/exec] Disclosure: Please note that some of the links below are affiliate links and I will earn a commission if you purchase through those links (at no extra cost to you). I recommend that you do your own independent research before purchasing any product or service. This article is not a guideline, a recommendation or endorsement of specific products.
Tips and Tricks for designing great Infographics
Before you start looking at the infographic design elements below there are a few handy tips you should review.
- Data is key: make sure the topic is interesting and that you have a good and reliable set of data
- Make it trustworthy: add references to you data sources
- Do some good story-telling: Think of the infographic as a story where you build up awareness and facts using the data.
- Make it matter: Draw conclusions that can be supported by the data set. Have a easy to follow red line that eventually lead to reasonable conclusions
- Choose a design style that match the topic. E.g. if the infographic is about popularity of classical music (just kidding) then don’t use high tech super modern and cool design elements.. consider a more old fashion style.
- Decide on a color scheme that you use throughout the entire infographic design
- Keep it simple: find ways to illustrate complex and detailed data sets in a simple and visual way. Use relevant icons to give the data some life.
- Use well know and easy to understand diagrams, tables, charts, time-lines, annotated maps
- Use color and size on related/similar objects to make different values visually differ
- Test it: Let other people review it before you publish… you may see the light only because you worked with the data for hours…
- Be inspired: look at as many good infographics before you start designing yourself
Infographic design elements for your own designs
Infographics Design Elements
A set of conceptual elements to create your infographic. Includes over 30 Icons.
Available formats: JPG Image, Vector EPS, AI Illustrator

Premium graphics by Graphic River
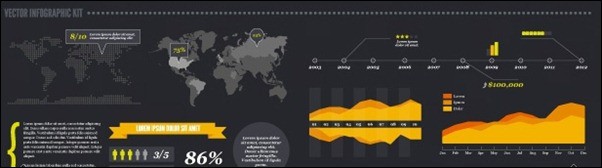
Vector Infographic Kit
Available formats: Vector EPS

Free (attribution required) graphics by medialoot
Infographic Design Elements Template Pack 01
This is a huge template pack of infographic elements: charts, graphics, shapes, icons etc..
Available formats: Vector EPS, AI Illustrator

Premium graphics by Graphic River
Minimalistic Infographic Pack
Cool infographic pack for your print/web/presentation ideas.
Available formats: Vector EPS, AI Illustrator

Premium graphics by Graphic River
World – Infographic Design Elements – Visual Information
This infographic template file includes dozens of professional graphic elements, great for any design you need, such as presentations, websites, ads, brochures, posters etc.
Available formats: Photoshop PSD

Premium graphics by Graphic River
Info Graphic Design Elements Vector
This is a pack of 6 files EPS with all sorts of useful graphics to make this work, with which they can certainly save time in creating them and so we can focus more on the creative process.
Available formats: Vector EPS

Free graphics by freevectorsdaily
Galaxy Infographic
Great looking styles pie chart for infographics designs. File included a fully layered Photoshop PSD.
Available formats: Photoshop PSD

Premium graphics by Graphic River
Infographic Vector Kit

Free graphics by WebdesignerDepot
Get Minimal – World Map
Completely editable AI document, easy to change colors, fonts and styles. Included in the package also background variations and bonus icons.
Available formats: Vector EPS, AI Illustrator

Premium graphics by Graphic River
Infographic Element set
Graphs, Charts, Lines, Shapes, all you need for make your own Infographic! All elements in vector shapes, allowing you to change the size, color, and more without losing quality.
Available formats: Photoshop PSD

Premium graphics by Graphic River
Bar Charts Infographic Elements
This is a set of 14 bar charts made in PSD vector format. Fully and easily editable – just shape and text layers, without layer masks or raster layers.
Available formats: Photoshop PSD

Premium graphics by Graphic River
Infographic design elements
Infographic elements with icons. Vector eps10 illustration. Orange blue and green colors.
Available formats: Vector EPS

Premium graphics by Graphic River
Infographic Elements
Set of info graphic design elements for your presentation. 3d world map, 3d people icons, map pins, charts… Well organised layered AI (CS) and EPS (CS) files. 4 color options. Easy editable vector files.
Available formats: Vector EPS, AI Illustrator

Premium graphics by Graphic River
Infographic Elements with world map
Infographic Elements with world map and a map of the subway. Text to curves.
Available formats: Vector EPS

Premium graphics by Graphic River
Business data elements vector
Available formats: Vector EPS

Free graphics by zezu
Go Green – Infographic Design Elements – info template
This PSD file Includes several professional graphic elements, great for any design you need, such as presentations, websites, ads, brochures, posters etc.
Available formats: Photoshop PSD

Premium graphics by Graphic River
Graphic Charts Elements
Available formats: Photoshop PSD

Premium graphics by Graphic River
Infographic Template and Charts v5
Here are all the elements you will need for you to customize your own inforgraphic. Bar charts, pie graphs, quick stats, and more!
Available formats: Photoshop PSD

Premium graphics by Graphic River
Infographic Elements
This set contains 21 infographic design elements you can use in presentations, slide shows, display statistics, websites, prints and more. Each graph is fully editable and organized into distinctly colored layer groups.
Available formats: Photoshop PSD
![infographic-elements[3]](http://www.tripwiremagazine.com/wp-content/uploads/2012/08/infographic-elements3.jpg "infographic-elements[3]")
Premium graphics by designtnt
Retro infographics account scheme with a liquid
This is a retro infographics account scheme with a liquid. Text to curves.
Available formats: Vector EPS

Premium graphics by Graphic River
Lars is passionate about web design, web development, SEO, social media and loves to look into new technologies, techniques, tools etc. and to write articles for tripwire magazine readers.


nice work. thank.
Wow! Thank you so very much!
Thank you so much for sharing this! I’ve been looking for this for a while now.
Woah! big help! thanks!
Thanks a lot for these Links! Lars.
I was looking for something like this, great help!
Thanks for these Links!
Great help!
—–stooni
[…] are visual representations of information. They use graphic design elements to present data and complex information in a simple and meaningful […]
Great links. Thanks for sharing!